

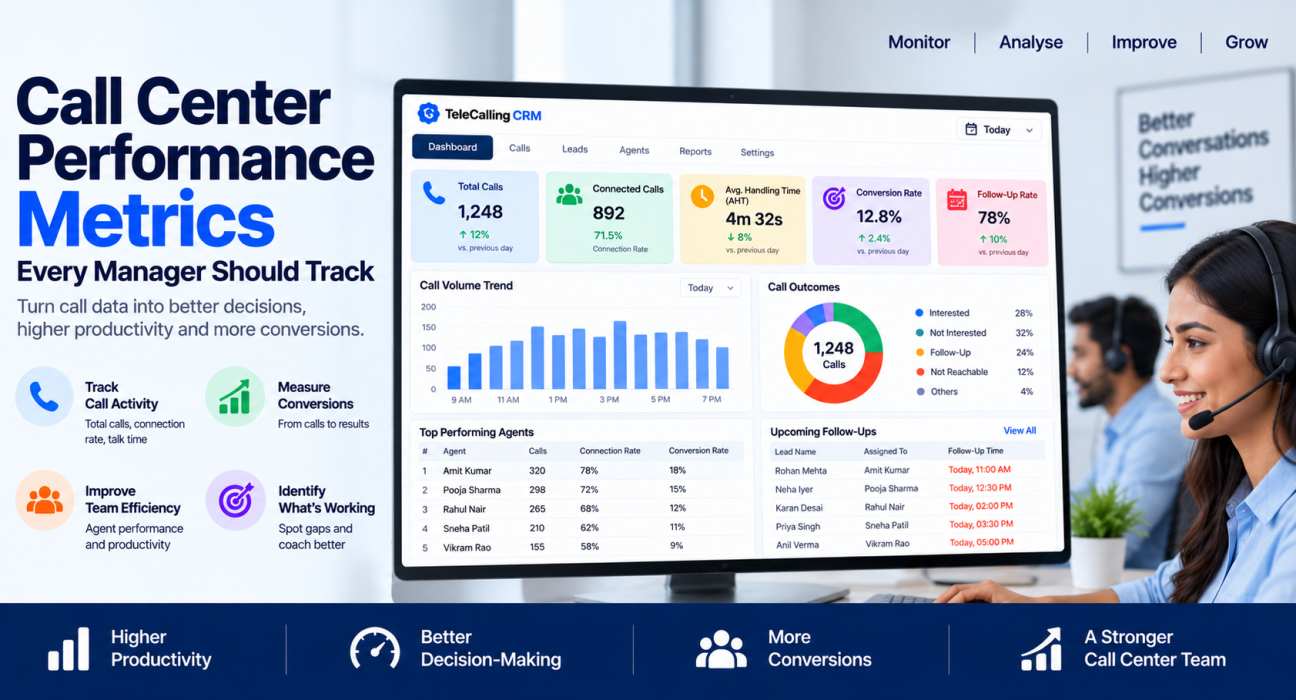
Call Center Performance Metrics Every Manager Should Track
A call center manager checking numbers at the end of the day often finds the same problem: too many reports, not enough clarity. Calls were made, some leads converted, a few agents were busy — but which numbers actually explain why the team is winning or losing?
Call center performance metrics solve this problem when they are chosen and read correctly. Most teams that struggle with outbound performance are not short of data. They are short of a small, well-understood set of numbers that connect directly to revenue and customer experience. Businesses working on this can use tools built for call center CRM and reporting to bring these numbers into one place instead of chasing them across spreadsheets and call logs.
This article explains the metrics that matter most, how to calculate them, and how to use them to improve a calling team’s output.
What Are Call Center Performance Metrics?
Call center performance metrics are measurable indicators that show how effectively a calling team is working. They cover three broad areas: call activity (how many calls, how long), conversion (how many calls turn into results), and team efficiency (how well agents and processes are performing).
A useful metric answers a specific question. “How many calls did we make?” is activity. “How many of those calls led to a sale?” is conversion. “How much of an agent’s shift is spent actually talking to a customer?” is efficiency. A manager who tracks all three gets a complete picture; one who tracks only call volume gets a partial and often misleading one.
Why Call Center Metrics Matter
Tracking the right metrics changes how a manager runs a call center, in three practical ways.
- It separates busy from effective. An agent can make 150 calls a day and close nothing. Another can make 60 calls and close 12 deals. Volume alone hides this difference.
- It shows where leads are lost. Metrics like connection rate and follow-up rate point to the exact stage where prospects are dropping off — bad numbers, poor timing, or missed callbacks.
- It supports fair coaching. Instead of vague feedback like “call more,” managers can point to specific numbers — talk time, conversion rate, follow-up discipline — and coach against them.
Teams that skip this discipline usually end up managing by gut feeling, which does not scale once the team grows past a handful of agents.
Core Call Center Performance Metrics
1. Total Calls Made
The simplest metric: how many outbound calls an agent or team made in a given period. It is a starting point, not a conclusion. High call volume with low conversions usually points to poor lead quality or a weak pitch, not a lazy team.
2. Connection Rate (Answer Rate)
Connection rate is the percentage of dialed calls that are actually answered.
Formula: (Calls answered ÷ Total calls dialed) × 100
A low connection rate often has nothing to do with the agent. It can point to bad phone numbers, poor calling time slots, or a lead source that supplies low-quality data. This is one of the first metrics to check before blaming agent performance.
3. Average Handling Time (AHT)
AHT measures the average duration of a call, including hold time and after-call work like logging notes.
Formula: (Total talk time + hold time + after-call work time) ÷ Total number of calls
AHT is easy to misuse. A shorter AHT is not automatically better — a rushed call can hurt conversion just as much as a needlessly long one. It is most useful when compared across agents handling similar lead types, not as an isolated target.
4. Conversion Rate
Conversion rate is the percentage of calls (or leads) that result in the desired outcome — a sale, a qualified lead, or a booked appointment, depending on the business.
Formula: (Number of successful outcomes ÷ Total calls or leads worked) × 100
This is usually the metric leadership cares about most, because it connects directly to revenue. But conversion rate should always be read alongside call volume and connection rate — a high conversion rate on a tiny sample size can be misleading.
5. First Call Resolution (FCR) / First Call Close
In sales-focused calling, this tracks how many leads convert or resolve on the first contact, without needing repeated follow-ups. In support-focused calling, it tracks how many customer issues get resolved without a second call.
A low FCR often means agents lack the information or authority to close matters on the spot, leading to more calls and slower resolution overall.
6. Follow-Up Rate and Follow-Up Timeliness
Follow-up rate measures how many leads that required a second or third touch actually received one, and how close to the scheduled time it happened.
This is one of the most commonly ignored metrics, and one of the most costly to ignore. In most outbound sales processes — real estate, education, insurance, finance — a meaningful share of conversions come from the second, third, or fourth call, not the first. Manual tracking of callbacks in spreadsheets or notebooks is where most leads quietly go cold. Structured lead follow-up software that schedules and reminds agents about callbacks reduces this leakage significantly.
7. Call Abandonment Rate
This tracks the percentage of inbound calls where the customer hangs up before reaching an agent, usually due to long wait times. It is more relevant for inbound and blended call centers than pure outbound teams, but worth monitoring wherever inbound queues exist.
8. Agent Utilization Rate
Utilization measures how much of an agent’s scheduled shift is spent on productive call-related work — talking, wrapping up notes, or actively dialing — versus idle time.
Formula: (Time spent on calls and call-related work ÷ Total logged-in time) × 100
Low utilization does not always mean low effort. It can point to gaps in lead supply, technical delays, or dialer inefficiency. A live view of agent status — on call, idle, in wrap-up — makes this easier to diagnose in real time than a daily summary report.
9. Cost Per Call and Cost Per Conversion
For managers accountable to a budget, these numbers matter as much as activity metrics.
Cost per call: Total calling operation cost ÷ Total calls made Cost per conversion: Total calling operation cost ÷ Total conversions
These figures help justify investment in better lead sources, more agents, or better tools, since they translate call center activity into a language finance teams understand.
10. Customer Satisfaction (CSAT) and Sentiment
Where post-call surveys or quality reviews collect feedback, CSAT and sentiment scores show whether the team is winning calls without damaging customer trust. A team that converts well but scores poorly on satisfaction is likely to see higher churn or complaints later.
11. Agent-Level Leaderboard Metrics
Comparing agents on calls made, conversion rate, and talk time side by side helps identify top performers and coaching opportunities. This works best as a supporting view alongside individual metrics, not as the sole measure of performance, since lead quality can vary between agents.
12. Lead Response Time
Lead response time measures how quickly a new lead receives its first call after a website form, ad campaign, or portal captures it. Response time has a well-documented effect on conversion: leads contacted within minutes convert at meaningfully higher rates than leads contacted hours later. Businesses using telecalling software that auto-assigns and queues new leads for immediate calling tend to see faster response times than teams relying on manual assignment.
How These Metrics Work Together: A Quick Reference
| Metric | What It Tells You | Watch For |
|---|---|---|
| Connection rate | Lead/number quality | Sudden drops signal bad data source |
| AHT | Call efficiency | Too low can mean rushed calls |
| Conversion rate | Overall effectiveness | Read with volume, not alone |
| Follow-up rate | Pipeline discipline | Missed callbacks = lost revenue |
| Utilization rate | Agent productivity | Low rate may mean lead shortage |
| Cost per conversion | Budget efficiency | Rising cost may signal lead quality drop |
| Lead response time | Speed to contact | Delays sharply reduce conversion odds |
Common Mistakes Managers Make With Call Metrics
- Tracking volume alone. Call counts without conversion or connection context reward busywork, not results.
- Comparing agents without adjusting for lead quality. An agent working cold, purchased lists will naturally underperform one working warm, inbound leads.
- Reviewing metrics only monthly. By the time a monthly report shows a problem, weeks of lost conversions have already happened. Weekly or daily review catches issues earlier.
- Ignoring follow-up metrics. Many managers focus entirely on first-call outcomes and miss that a large share of revenue comes from disciplined follow-up.
- Using metrics to punish instead of coach. Numbers work best as a diagnostic tool, not a scoreboard for blame. Context — lead source, time of day, campaign type — matters before drawing conclusions.
How TeleCalling CRM Supports Metric Tracking
Tracking these metrics manually across spreadsheets and call logs is time-consuming and error-prone, especially as a team grows. TeleCalling CRM brings call tracking, lead management, and real-time analytics into one system, so metrics like connection rate, conversion rate, talk time, and follow-up status are visible without manual compilation.
Its live war room view shows agent status, talk time, and utilization as it happens, rather than after the fact. The platform also includes AI-based call analysis that auto-generates call summaries, sentiment scoring, and quality scores, giving managers a faster way to review call quality alongside the numbers. For teams evaluating options, this kind of integrated telecaller CRM setup removes the need to stitch together a dialer, a spreadsheet, and a separate reporting tool.
FAQs
What is the most important call center metric?
No single metric tells the whole story — conversion rate, connection rate, and follow-up rate together give the clearest picture. Conversion rate shows results, but managers should always read it alongside call volume and lead quality.
How often should call center metrics be reviewed?
Daily or weekly review works best for outbound sales teams. Waiting for monthly reports means problems like poor lead quality or missed follow-ups go uncorrected for too long.
What is a good average handling time for a call center?
AHT varies heavily by industry and call purpose, so there is no universal “good” number. Managers should benchmark it against their own team’s historical average and adjust for call type, rather than comparing it blindly across industries.
How is conversion rate different from connection rate?
Connection rate shows how many dialed calls someone answers. Conversion rate shows how many of those calls (or leads) result in the desired outcome, such as a sale or booked appointment. A team can have a high connection rate and a low conversion rate if the pitch or lead quality is weak.
Do these metrics apply to both inbound and outbound call centers?
Most apply to both, though some suit one side better. Call abandonment rate matters mainly for inbound queues, while lead response time and follow-up rate sit closer to the center of outbound sales calling.
Can small teams benefit from tracking these metrics?
Yes. Even a 5-agent team gains from tracking connection rate, conversion rate, and follow-up discipline, since these numbers directly affect how many leads turn into revenue. Tracking can stay simple at a small scale, but the discipline still matters.
What tools help track call center metrics without manual work?
A CRM built for calling teams removes most of the manual effort involved in tracking these numbers by hand. Call logging, automatic follow-up reminders, and real-time reporting replace the spreadsheet work managers would otherwise do themselves.
Conclusion
Call center performance metrics are only useful when a manager reads them together, not in isolation. Volume, connection rate, conversion rate, follow-up discipline, and cost per conversion each answer a different question, and the full picture only appears when they are viewed side by side. Teams that build this habit — reviewing the right numbers regularly and acting on what they show — consistently outperform teams that rely on instinct alone.
For teams still tracking these numbers across spreadsheets and manual call logs, moving to a dedicated CRM for telecallers can make this reporting far more reliable, without adding extra work for agents on the floor.