

How to Calculate Sales Rep Productivity Metrics (With Formulas)
Ask a sales manager how a rep performed last quarter, and you’ll usually get a number back fast: deals closed, revenue booked. Ask how productive that rep actually was, and the answer gets a lot shakier.
Here’s the thing — those two questions aren’t the same. A rep who closed 10 deals off 15 visits did something very different from a rep who needed 60 visits to hit the same number, even though both would look identical on a revenue report. If you’re only looking at outcomes, you’re missing half the story.
That’s what sales rep productivity metrics are for. They tell you not just what a rep achieved, but how efficiently they got there — which matters a lot when you’re trying to coach reps, plan territories, or figure out why one region keeps underperforming despite everyone “working hard.”
This article breaks down the actual metrics and formulas worth tracking, where most teams go wrong measuring this, and where software fits in if manual tracking has become the bottleneck.
What Does “Sales Rep Productivity” Actually Mean?
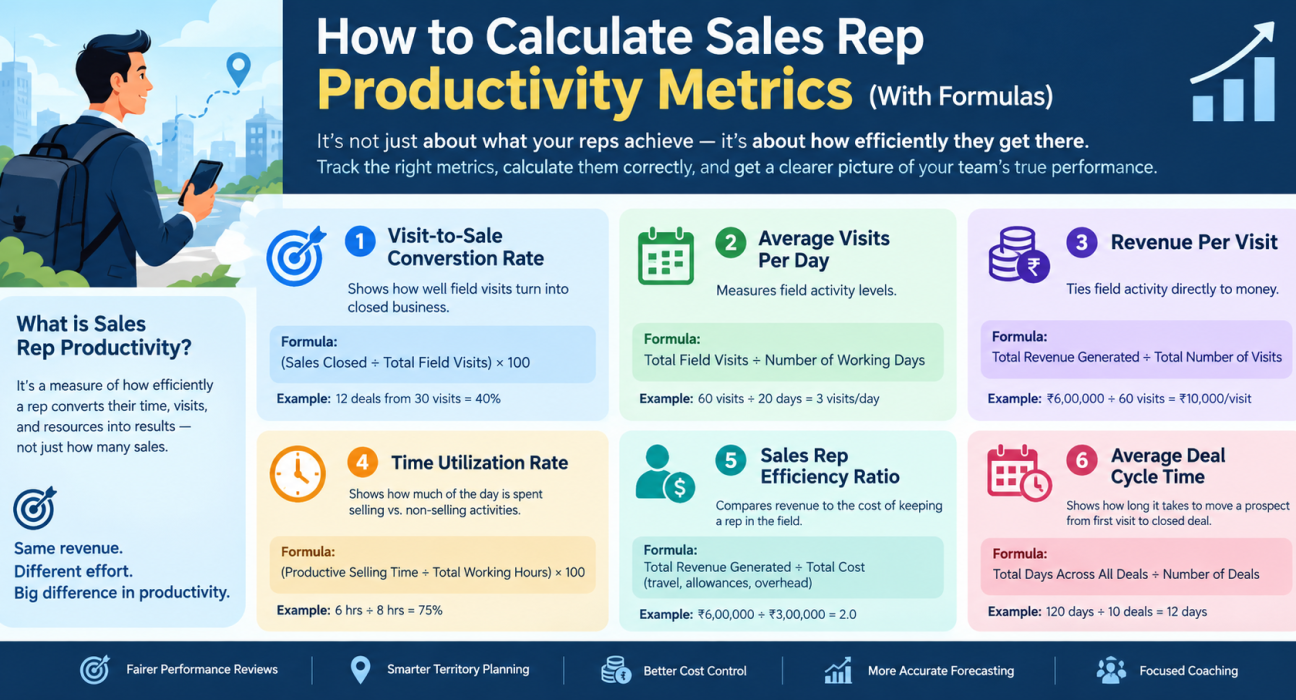
Sales rep productivity is a measure of how efficiently a rep converts their time, visits, and resources into results. Not just how many sales — how much effort, time, and cost it took to get them.
Two reps can post the same revenue number and still have wildly different productivity levels. One might be closing deals in 20 visits a week; the other might need 50. On paper, they look equal. In practice, one is clearly working smarter — or has a much better territory.
This distinction is exactly why productivity metrics matter more than raw performance numbers alone.
[Image suggestion 1 — see Image Suggestions section]
Why Most Teams Should Be Tracking This (And Usually Aren’t)
A lot of sales teams still run purely on revenue targets. It’s simple, and it’s easy to report on. But it hides a lot.
- It makes performance reviews fairer. Revenue alone tends to favor reps with easier or larger territories — not necessarily the ones putting in the most effective work.
- It sharpens territory planning. Once you can see who’s stretched thin and who has room to take on more, redistributing accounts stops being a guessing game.
- It controls field costs. Travel time and visit data make it much easier to spot when fuel or allowance spending is out of line with what a rep is actually accomplishing.
- It improves forecasting. Knowing your average visit-to-close ratio gives you a far more grounded basis for pipeline predictions than gut feel.
- It makes coaching more specific. Instead of telling a rep “you missed your number,” you can point to exactly where efficiency is breaking down — too many visits per close, too much dead travel time, whatever it is.
The Core Sales Rep Productivity Metrics (And How to Calculate Each One)
There’s no single number that captures productivity on its own. You need a small set of metrics that, together, show both activity and efficiency. Here’s what actually matters.
1. Visit-to-Sale Conversion Rate
This tells you how well field visits are turning into closed business.
Formula: (Sales Closed ÷ Total Field Visits) × 100
Say two reps each close 12 deals. One did it in 60 visits (20% conversion), the other in 30 visits (40% conversion). Same result, but one rep is running twice as efficiently — which is exactly the kind of gap a revenue report alone would never show you.
2. Average Visits Per Day
A basic but useful gauge of field activity levels.
Formula: Total Field Visits ÷ Number of Working Days
If this number is consistently low across a rep or a whole team, don’t assume it’s a motivation problem. Check route planning first — poor routing eats field hours fast, and it’s rarely the rep’s fault.
3. Revenue Per Visit
This ties field activity directly to money, which usually matters more to leadership than visit counts alone.
Formula: Total Revenue Generated ÷ Total Number of Visits
It’s particularly useful when comparing reps across territories that aren’t really comparable in size or account value.
4. Time Utilization Rate
How much of a working day actually goes toward selling, versus everything else that eats into it.
Formula: (Productive Selling Time ÷ Total Working Hours) × 100
“Productive time” usually means active customer interaction — meetings, demos, follow-ups. It doesn’t include commute time or the twenty minutes a rep spends waiting in a lobby.
5. Sales Rep Efficiency Ratio
This one weighs what it costs to keep a rep in the field against what they’re actually bringing in.
Formula: Total Revenue Generated ÷ Total Cost (travel, allowances, overhead)
A rep can look like a strong performer purely on revenue and still be a net loss once fuel, per diems, and other field costs are factored in.
6. Average Deal Cycle Time
How long it typically takes a rep to move a prospect from first visit to closed deal.
Formula: Total Days Across Closed Deals ÷ Number of Deals Closed
Shorter cycles — assuming deal quality holds up — usually mean a rep is managing their pipeline well rather than letting prospects go cold.
7. Distance Traveled vs. Productive Outcomes
For roles where reps are constantly on the road, this metric can expose route and territory problems fast.
Formula: Total Distance Traveled ÷ Number of Productive Visits
A high number here is often a routing issue, not a rep issue — badly planned beats can quietly burn hours that should be going toward selling.
Quick Reference Table
| Metric | What It Measures | Formula |
|---|---|---|
| Visit-to-Sale Conversion Rate | Sales efficiency per visit | Sales Closed ÷ Visits × 100 |
| Average Visits Per Day | Field activity level | Total Visits ÷ Working Days |
| Revenue Per Visit | Revenue impact per visit | Total Revenue ÷ Total Visits |
| Time Utilization Rate | Selling time vs. total hours | Productive Hours ÷ Total Hours × 100 |
| Sales Rep Efficiency Ratio | Revenue vs. cost | Total Revenue ÷ Total Cost |
| Average Deal Cycle Time | Speed of closing deals | Total Days ÷ Deals Closed |
| Distance vs. Outcomes | Route and travel efficiency | Distance Traveled ÷ Productive Visits |
[Image suggestion 2 — see Image Suggestions section]
How to Actually Calculate This for Your Team
Knowing the formulas is one thing. Applying them consistently is where most teams stumble. Here’s a practical sequence:
- Decide what “productive” means for your team first. Is it closed revenue, qualified leads, or completed visits? Get this settled before you touch a formula — it changes everything downstream.
- Get clean field activity data. You need real visit counts, durations, and timestamps — not a rep’s memory of their day, written up hours later.
- Connect every visit to an outcome. Sale closed, follow-up booked, lead lost — whatever it is, it needs to be logged against the visit.
- Run the formulas per rep, not just as a team average. A team-wide number hides exactly the variation you’re trying to find.
- Benchmark against peers and past performance. A single rep’s number means very little in isolation.
- Watch trends over time, not one-off snapshots. A rep improving steadily from a low base can matter more long-term than someone flat at an “acceptable” number.
Where Teams Usually Get This Wrong
Even teams that genuinely try to track productivity tend to run into the same handful of problems.
- Manual logging is slow and incomplete. If reps fill out visit logs at the end of the day (or the week), the data is already stale — and probably missing details — before anyone looks at it.
- No way to verify field time actually happened. Without location data, a “visit” is really just a claim.
- Inconsistent logging across reps. One person’s five-minute drop-in gets logged the same as another’s hour-long meeting. That inconsistency wrecks any team-wide comparison.
- Missing travel and route data. Without it, you can’t tell whether low productivity is a rep problem or a territory problem.
- Metrics read in isolation. A conversion rate without revenue or cost context can tell a misleading story either way.
Practices Worth Adopting
- Set targets by territory, not one blanket number for the whole team — different patches genuinely allow for different activity levels.
- Fix routing and beat planning before assuming a rep is underperforming. A lot of “low productivity” is really just wasted windshield time.
- Automate visit and attendance capture wherever possible, so the numbers reflect what happened rather than what someone remembered.
- Review productivity numbers on a regular cadence — weekly or monthly beats waiting for annual reviews.
- Talk to reps about the numbers, not just at them. They can explain seasonal dips, traffic patterns, or account-specific issues that raw data won’t show.
- Use dashboards that update in real time so small dips get caught before they become quarter-ending surprises.
[Image suggestion 3 — see Image Suggestions section]
Where Software Fits Into All This
Doing this manually — spreadsheets, paper visit sheets, end-of-day recaps typed from memory — is workable at a small scale. It gets messy fast once you’re managing more than a handful of reps, and errors creep in easily.
Businesses looking to simplify this process can use field force management software such as FieldExecutives, which handles most of the underlying data collection automatically rather than relying on reps to report it after the fact. Instead of a rep typing up their day at 6pm, FieldExecutives logs GPS-verified attendance and visit check-ins as they happen. [Internal Link Opportunity: FieldExecutives GPS Tracking feature page]
That kind of automatic logging gives you accurate visit counts, time-per-customer data, and travel distance without chasing anyone down for a report. Geofencing and customer visit verification confirm a visit actually took place at the right location, which removes a lot of the guesswork from conversion rate and revenue-per-visit numbers. [Internal Link Opportunity: FieldExecutives Geofencing feature page]
Route and beat planning tools also address one of the biggest productivity killers directly — poorly planned territories — by helping reps cover more ground without burning hours in transit. [Internal Link Opportunity: FieldExecutives Route & Beat Planning page]
And because this data feeds into real-time dashboards, managers aren’t stuck waiting for a monthly report to see what’s actually happening in the field. [Internal Link Opportunity: FieldExecutives Real-Time Reporting feature page]
Conclusion: Why Sales Rep Productivity Metrics Matter More Than Revenue Alone
Revenue alone was never the full picture. It tells you what happened, not how efficiently it happened — and that gap is exactly where sales rep productivity metrics earn their place.
To recap what actually matters:
- Visit-to-sale conversion rate, revenue per visit, and time utilization measure efficiency, not just output.
- Sales rep efficiency ratio and deal cycle time show whether a “top performer” is actually worth what it costs to keep them in the field.
- Distance vs. productive outcomes flags routing problems before a rep gets unfairly blamed for them.
- Consistent, real-time data — not end-of-day memory logs — is what makes every one of these formulas reliable.
Track these sales rep productivity metrics regularly, and you get fairer performance reviews, smarter territory decisions, and far fewer surprises on field costs. None of it requires complicated math — it mostly comes down to having accurate, current data to run the formulas on in the first place.
If manual tracking is what’s holding your team back, platforms like FieldExecutives can take that data collection off your plate entirely, so your time goes into acting on the numbers instead of chasing them down.