


Top Telecalling KPIs to Measure Sales Team Performance
A sales manager checks the daily call log. Fifty calls today, sixty yesterday, forty-five the day before. But nobody can tell if the team is actually improving or just staying busy.
This is a common problem in telecalling teams. Call counts alone do not tell you much. What matters is a small set of telecalling KPIs that show whether calls are turning into conversations, conversations into leads, and leads into revenue. Teams that track their calling activity through lead management software usually find these numbers far easier to pull together than chasing them across spreadsheets and call registers.
This article explains which telecalling KPIs matter most, how to calculate them, and how to use them to improve team performance — without turning your dashboard into a wall of numbers nobody reads.
What Are Telecalling KPIs?
Telecalling KPIs (Key Performance Indicators) are measurable data points that show how well a telecalling or telesales team is performing. They typically cover four areas: call activity, call quality, conversion, and productivity.
Good telecalling KPIs answer a simple question: is this call activity moving leads closer to a sale? A high number of calls with a low connection rate or low conversion rate is not real performance — it’s just noise.
Why Telecalling KPIs Matter for Sales Teams
Without clear KPIs, sales managers end up making decisions on gut feel. They might praise the agent who makes the most calls, even if that agent connects with fewer prospects or closes fewer deals than a colleague who calls less but follows up better.
Tracking the right KPIs helps businesses:
- Identify which agents are genuinely productive, not just busy
- Spot bottlenecks in the sales process (for example, poor follow-up discipline)
- Set realistic, data-backed targets instead of arbitrary call quotas
- Coach agents based on actual behaviour, not assumptions
- Forecast revenue more accurately based on pipeline movement
This matters across industries. A real estate telecaller following up on property enquiries has a different call rhythm than an insurance telecaller renewing policies, but both need to know if their calling effort is producing results.
Understanding the Problem: Why Call Count Alone Fails
Many sales teams still measure performance using a single number — total calls made per day. This is a weak KPI on its own, for a few reasons:
- It ignores call outcomes. Ten calls that end in a sale are worth more than a hundred calls that go nowhere.
- It can be gamed. Agents under pressure to hit a call quota may dial numbers they know won’t answer, just to inflate the count.
- It hides quality problems. A high call count with poor conversation quality (rushed pitches, no follow-up questions) will eventually show up as low conversions — but not immediately.
- It doesn’t account for lead quality. An agent working cold, unverified leads will naturally show worse numbers than one working warm, referred leads, even with identical effort.
The fix is not to ignore call volume, but to pair it with quality and outcome metrics. That combination is what a proper KPI framework provides.
The Core Telecalling KPIs to Track
1. Total Calls Made
The basic activity metric — how many outbound calls an agent or team made in a given period (day, week, month). Useful as a baseline, but should always be read alongside connection rate and conversion rate.
Direct answer: Total calls made is simply the count of outbound dials in a period. On its own it measures effort, not results, so pair it with connection and conversion metrics for a true performance picture.
2. Connection Rate (Answer Rate)
This shows what percentage of dialled calls were actually answered.
Formula: (Calls Answered ÷ Calls Made) × 100
A low connection rate usually points to bad data (wrong or outdated numbers), poor calling hours, or too many unqualified leads in the list. This is one of the clearest early-warning KPIs, because it flags data quality problems before they waste an agent’s entire day.
3. Talk Time / Average Call Duration
The average length of a connected call. Very short average calls may indicate rushed pitches or poor engagement. Very long calls aren’t automatically good either — they need to be checked against conversion outcomes to see if the extra time is actually productive.
4. Conversion Rate
The percentage of calls (or leads) that result in a desired outcome — a sale, a qualified lead, a scheduled meeting, or whatever the team defines as a “win.”
Formula: (Successful Outcomes ÷ Total Calls or Leads Worked) × 100
Conversion rate is arguably the single most important telecalling KPI, because it directly reflects the outcome the business cares about, not just activity.
5. Lead Response Time
How quickly an agent calls a new lead after it enters the system. Industry data consistently shows that response speed strongly affects whether a lead converts — a lead that sits untouched for hours is far less likely to answer or engage than one called within minutes.
6. Follow-Up Adherence Rate
The percentage of scheduled follow-up calls that were actually completed on time. Leads rarely convert on the first call. A team with poor follow-up discipline is quietly losing deals that were already in progress.
Formula: (Follow-ups Completed On Time ÷ Total Follow-ups Scheduled) × 100
7. Average Deal Size / Revenue per Agent
For teams selling directly (real estate, insurance, finance, B2B), tracking the value of closed deals per agent shows who is generating real revenue, not just activity or lead volume.
8. Cost per Lead / Cost per Conversion
Relevant for teams running paid lead generation (Facebook Ads, Google Ads, property portals). This shows whether the marketing spend on a lead source is actually converting into business through the calling team.
9. Call Quality Score
A structured rating (often based on a checklist or scorecard) that measures how well an agent handled a call — tone, product knowledge, objection handling, and adherence to the script. Some teams use manual call reviews for this; others use call analysis tools that transcribe and score calls automatically.
10. Agent Utilization / Idle Time
The proportion of an agent’s working hours actually spent on calls versus idle or between calls. Useful for identifying capacity issues — for example, agents sitting idle because leads aren’t being assigned fast enough.
11. Lead-to-Opportunity and Opportunity-to-Close Ratios
These pipeline-stage ratios show where leads are dropping off. If many leads reach “interested” but few progress to “closed,” the problem is likely in follow-up or negotiation, not in initial lead quality.
KPI Summary Table
| KPI | What It Measures | Why It Matters |
|---|---|---|
| Total Calls Made | Calling activity | Baseline effort measure |
| Connection Rate | % of calls answered | Flags data or timing issues |
| Talk Time | Average call length | Signals engagement quality |
| Conversion Rate | Calls turning into wins | Core outcome metric |
| Lead Response Time | Speed of first contact | Directly affects conversion odds |
| Follow-Up Adherence | On-time follow-ups completed | Prevents leads going cold |
| Revenue per Agent | Deal value closed per agent | Shows real business impact |
| Cost per Lead/Conversion | Marketing spend efficiency | Connects sales to lead source ROI |
| Call Quality Score | How well calls are handled | Identifies coaching needs |
| Agent Utilization | Productive time vs idle time | Highlights capacity problems |
| Pipeline Stage Ratios | Drop-off between stages | Pinpoints where deals stall |
Real-World Examples
Real estate: A property sales team tracks connection rate and follow-up adherence closely, because property enquiries from portals like 99acres or MagicBricks go cold fast if not called within minutes and followed up consistently over weeks.
Insurance: A renewal team focuses on conversion rate and revenue per agent, since the goal is not just calling policyholders but actually closing renewals before expiry dates.
Education: An admissions telecalling team watches lead response time closely during peak enrolment season, when dozens of enquiries arrive daily and speed of the first call often decides whether a parent stays engaged.
These are illustrative examples of how different industries prioritise KPIs differently — the right mix depends on the sales cycle and lead source for each business.
Common Mistakes When Tracking Telecalling KPIs
- Tracking too many KPIs at once. Ten dashboards with fifty metrics create confusion, not clarity. Start with five or six core KPIs.
- Using call count as the only performance metric. As explained earlier, this rewards busywork over results.
- Not segmenting by lead source or industry vertical. A KPI that looks bad overall might actually be fine for one lead source and poor for another.
- Comparing agents without context. An agent working older, colder leads will naturally underperform one working fresh, warm leads on paper alone.
- Reviewing KPIs only monthly. By the time a monthly report shows a problem, weeks of lost opportunity have already passed. Weekly or even daily review of core KPIs catches issues earlier.
- Not acting on the data. Tracking KPIs without using them to coach agents or fix process gaps makes the entire exercise pointless.
How TeleCallingCRM Can Help
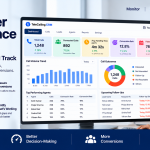
Manually calculating connection rates, follow-up adherence, and conversion ratios from call registers and spreadsheets is time-consuming and error-prone. A dedicated telecaller CRM can track these numbers automatically as calls happen, giving managers a real-time view instead of a delayed monthly summary.
Within TeleCallingCRM, features such as real-time analytics dashboards, connection and answer rate tracking, a custom report builder, and team leaderboards are built to support exactly this kind of KPI tracking, alongside call recording and AI-based call analysis for quality scoring. Follow-up scheduling and reminders also help teams keep an eye on follow-up adherence, one of the KPIs most likely to be missed in manual processes.
This is not a claim that any software alone fixes performance — KPIs still need to be reviewed and acted on by sales managers. But having accurate, real-time numbers removes the guesswork of pulling data together manually.
Frequently Asked Questions
What are the most important telecalling KPIs to start with?
If you are just starting out, track connection rate, conversion rate, and follow-up adherence rate first. These three give a solid picture of call quality, outcomes, and consistency without overwhelming the team with data.
How often should telecalling KPIs be reviewed?
Core KPIs like connection rate and calls made are best reviewed daily or weekly. Outcome-based KPIs like conversion rate and revenue per agent are typically reviewed weekly or monthly, depending on the sales cycle length.
What is a good conversion rate for a telecalling team?
This varies widely by industry, lead source, and sales cycle, so there is no universal benchmark. It’s more useful to track your own team’s conversion rate over time and aim for steady improvement than to compare against an unverified industry average.
Can telecalling KPIs be tracked without a CRM?
Yes, on a small scale, using spreadsheets and manual call logs. However, this becomes difficult to sustain as the team or call volume grows, which is why many teams move to sales calling software that tracks these metrics automatically.
Is call count a bad KPI?
Not bad, but incomplete. Total calls made is a useful activity measure, but it should always be paired with connection rate and conversion rate to understand whether that activity is producing results.
How do I measure call quality, not just call quantity?
Call quality is usually measured through structured call scoring — either manual reviews using a checklist, or automated call analysis tools that transcribe calls and score them on tone, script adherence, and objection handling.
Do telecalling KPIs differ by industry?
Yes. A real estate team may prioritise lead response time due to fast-moving enquiries, while an insurance renewal team may prioritise conversion rate and revenue per agent. The core metrics stay similar, but their relative importance shifts by industry.
Conclusion
Telecalling KPIs work best as a small, well-chosen set of metrics — not a long list nobody reviews. Connection rate, conversion rate, follow-up adherence, and revenue per agent together give a far more honest picture of team performance than call count alone.
Once these KPIs are defined, the next step is making them easy to track consistently. Businesses that move away from manual call registers toward a proper telecalling software solution typically find it much easier to review these numbers weekly and coach their teams based on real data, rather than guesswork.