


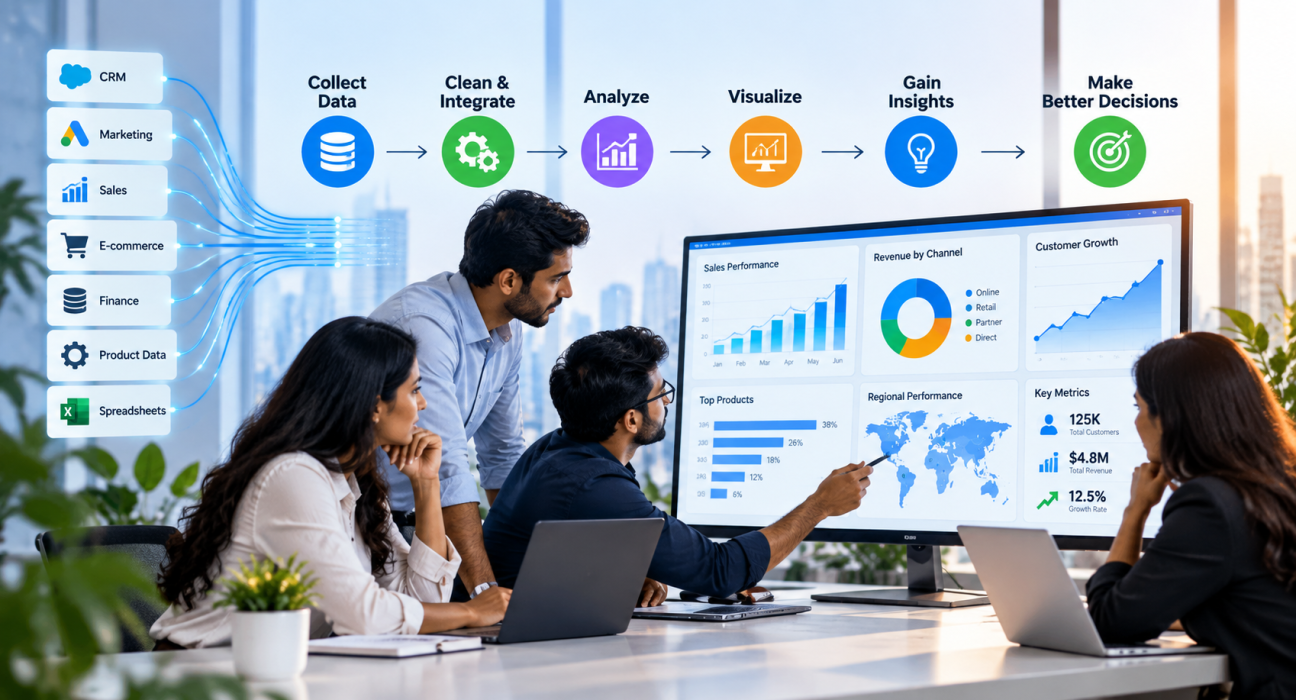
Most businesses already have more data than they can use. Sales figures sit in a CRM, campaign results in an ad platform, and financials in accounting software. Each system tells part of the story, but nobody can see the whole picture.
Business intelligence analytics closes that gap. BI companies turn data into insights by pulling it from multiple sources, cleaning and organizing it, analyzing it, and presenting the results in dashboards and reports that teams can act on.
This guide walks through how that process works, what BI providers actually do at each stage, and how to choose the right partner.
What Is Business Intelligence Analytics?
Business intelligence analytics is the practice of collecting, organizing, and analyzing business data to support better decisions. It combines data management, reporting, visualization, and analysis so that people can answer questions like “Which products drive our margin?” or “Why did churn rise last quarter?” without digging through spreadsheets.
BI is often confused with related terms:
- Business intelligence (BI): Focuses mainly on what has happened and what is happening now, through dashboards and reports.
- Data analytics: A broader term covering any examination of data to find patterns, including advanced statistical work.
- Data science: Focuses on building predictive models and algorithms, often with machine learning.
In practice, these overlap. A modern BI company usually blends all three, starting with reliable reporting and adding deeper analysis as the business matures.
How Do BI Companies Turn Data Into Insights?
BI providers typically follow a repeatable process. The names vary from company to company, but the stages are largely the same.
1. Define the business questions
Good BI starts with questions, not tools. A provider will usually begin by asking what decisions the business needs to make, who makes them, and what “success” looks like. A retailer might want to reduce stockouts, while a SaaS company might want to understand why trial users don’t convert.
This step determines which data matters, so skipping it is one of the most common causes of unused dashboards.
2. Identify and connect data sources
Next, the team maps where relevant data lives. Common sources include:
- CRM and sales platforms
- Marketing and advertising tools
- E-commerce and payment systems
- ERP and accounting software
- Product usage and application databases
- Spreadsheets and third-party data feeds
Engineers then build connections that move data from these systems into a central location on a regular schedule.
3. Clean, integrate, and store the data
Raw data is rarely ready to use. Customer names are spelled differently across systems, dates use inconsistent formats, and records are duplicated or missing. BI teams clean this data, standardize it, and combine it into one consistent structure.
The data is usually stored in a data warehouse or similar central repository. This gives the business a “single source of truth,” so finance and marketing aren’t arguing over whose numbers are right.
4. Model the data
Data modeling organizes information around how the business actually works: customers, orders, products, subscriptions, regions, and time periods. It also defines shared metrics, such as what counts as an “active customer” or how “revenue” is calculated.
This is an often-overlooked step. Without clear definitions, two dashboards can show different answers to the same question.
5. Analyze the data
With a clean foundation, analysts look for patterns, trends, and anomalies. They might segment customers by behavior, compare performance across regions, or trace a revenue drop back to a specific channel or product line.
Depending on the project, this may also include forecasting and predictive modeling.
6. Visualize and report
Insights only matter if people can understand them. BI companies build dashboards and reports that present key metrics clearly, usually with filters so users can explore the data themselves. Strong dashboards are focused: they show the handful of metrics a role needs, not every number available.
7. Enable action and iteration
The final stage is where value is created. Teams use the insights to adjust pricing, reallocate marketing budget, fix a bottleneck, or change inventory plans. Good BI providers also train staff, document the setup, and refine the dashboards as questions change.
The Four Types of Business Intelligence Analytics
Understanding these types helps you describe what you need to a provider.
| Type | Question it answers | Example |
|---|---|---|
| Descriptive | What happened? | Monthly sales by product category |
| Diagnostic | Why did it happen? | A drop in conversions traced to a slow checkout page |
| Predictive | What is likely to happen? | Forecasting demand for next quarter |
| Prescriptive | What should we do? | Recommending a reorder quantity based on forecasted demand |
Most businesses should start with descriptive and diagnostic analytics. Predictive and prescriptive work depends on clean, consistent historical data, so it tends to follow once the foundation is solid.
Tools and Technologies BI Companies Commonly Use
Providers generally work across a few layers of technology:
- Data integration and pipelines: Tools that extract data from source systems and load it into a central store.
- Data warehouses and lakes: Cloud platforms such as Snowflake, Google BigQuery, or Amazon Redshift.
- Transformation and modeling: Tools like dbt or SQL-based workflows.
- Visualization and reporting: Platforms such as Microsoft Power BI, Tableau, Looker, or Qlik.
- Advanced analytics: Python, R, and machine learning frameworks for forecasting and modeling.
(Verify current product names and capabilities before publishing, since vendors change features and branding often.)
The best tool is the one that fits your existing systems, budget, and team skills. A reputable BI company should explain why it recommends a particular stack rather than defaulting to the one it knows best.
A Practical Example: From Scattered Data to Clear Decisions
Imagine a mid-sized e-commerce business. Sales data lives in the store platform, ad spend in several marketing tools, and customer service tickets in a helpdesk system. Leadership suspects some ad campaigns bring in customers who buy once and never return, but no one can prove it.
A BI company would:
- Define the question: which acquisition channels produce the most valuable repeat customers?
- Connect the store, ad, and helpdesk data.
- Clean and match customer records across systems.
- Model metrics like customer lifetime value and repeat purchase rate.
- Build a dashboard comparing channels by long-term value rather than first-order revenue.
The result might be a decision to shift budget away from channels that attract one-time buyers. That is the difference between reporting numbers and generating an insight.
What Should You Look for in a Business Intelligence Company?
If you’re considering outside help, these criteria matter more than a long list of tool logos.
Business understanding. Can the provider talk about your industry and goals, not just technology? Look for questions about your decisions and KPIs in the first conversation.
Data engineering strength. Dashboards are only as good as the data behind them. Ask how they handle data quality, integration, and ongoing maintenance.
Relevant experience. Ask for case studies or references in similar industries or at a similar company size.
Transparency about approach. A good provider can explain its process, timeline, deliverables, and how it defines success.
Governance and security. Ask how they handle access controls, sensitive data, and compliance requirements relevant to your sector.
Training and handover. You should be able to use and maintain what they build, or at least understand it.
Support model. Clarify whether support continues after launch and what it costs.
How to compare providers
Create a shortlist of three to five companies and evaluate each against the same criteria. Platforms like GoFirms can help here, since businesses can use it to research and compare technology and IT service providers, review company profiles, and build that shortlist before reaching out. After that, request proposals based on the same project brief so the responses are comparable.
Questions to Ask Before You Hire
- Which business problems will this project solve first?
- How will you handle data from our existing systems?
- Who owns the data models and dashboards when the project ends?
- How do you validate that the numbers are accurate?
- What does a realistic timeline look like, and what do you need from our team?
- Can you share examples of similar projects?
- How will you measure whether the project succeeded?
Common Mistakes in BI Projects
- Starting with the tool, not the question. Buying a platform before defining decisions leads to attractive but unused dashboards.
- Ignoring data quality. Insights built on messy data erode trust quickly.
- Trying to measure everything. Too many metrics hide the ones that matter.
- Leaving business teams out. If end users aren’t involved, adoption suffers.
- Treating BI as a one-time project. Questions, systems, and data change, so BI needs ongoing care.
Getting Started: A Simple Checklist
- List the five to ten decisions your team struggles to make with current data.
- Identify which systems hold the data for those decisions.
- Note who needs to see the insights and how often.
- Set a rough budget and timeline.
- Shortlist providers and share the same brief with each.
- Start with a focused first phase, then expand.
Frequently Asked Questions
What is business intelligence analytics in simple terms? Business intelligence analytics means collecting and analyzing a company’s data so leaders can make better decisions. It brings information from different systems together, then presents it in dashboards and reports that show what is happening, why it is happening, and what to do next.
How do BI companies turn raw data into insights? They connect data sources, clean and combine the data, store it centrally, and model it around business metrics. Analysts then examine patterns and build dashboards and reports. The final step is helping teams use those findings to make decisions and refine them over time.
What is the difference between business intelligence and data analytics? Business intelligence mainly focuses on reporting and dashboards that show current and past performance. Data analytics is broader and includes deeper statistical analysis, forecasting, and experimentation. In practice, many providers offer both, and the two work best together.
How long does a business intelligence project take? It depends on the number of data sources, data quality, and the scope of reporting. A focused first phase with a few sources and core dashboards is often much quicker than an enterprise-wide rollout. Ask providers for a phased timeline based on your specific requirements.
Do small businesses need business intelligence analytics? Small businesses can benefit when their data is spread across several tools and decisions rely on guesswork. They don’t need a large setup. A lightweight approach with a few connected data sources and a handful of key dashboards can be enough to start.
How do I choose a business intelligence company? Start by defining your business questions and data sources. Then compare providers on industry experience, data engineering skills, process transparency, security practices, and post-launch support. Review case studies, ask for references, and request proposals against the same project brief.
Conclusion
Business intelligence analytics is less about fancy dashboards and more about a disciplined path from scattered data to confident decisions. BI companies do this by defining the right questions, connecting and cleaning data, modeling it around real business metrics, analyzing it, and helping teams act on what they find.
If you’re ready to bring in a partner, define your goals first, then compare providers using consistent criteria. A platform like GoFirms can help you research and shortlist business intelligence and IT service providers so you can start those conversations with a clearer picture of your options.